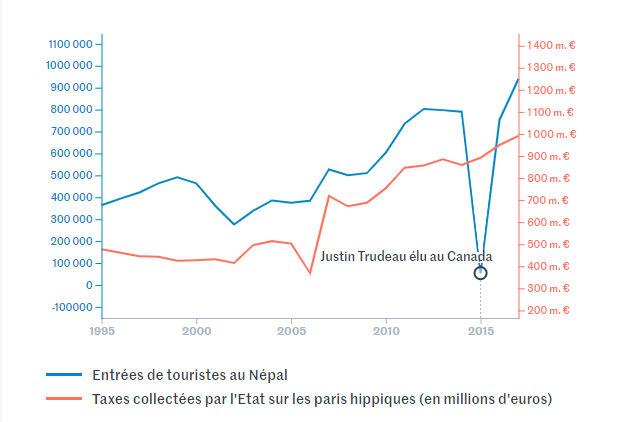
We were inspired by the article published in Le Monde on the difference between correlation and causation. The amalgam is easy, the shortcuts frequent, and the whole thing can easily be transposed to revenue management.
The art of jumping to conclusions
Le Monde has published a very good article on the difference between correlation and causation.
The random generator available in the article allows you to compare two very similar curves, whose fates seem to be linked. The correlation coefficients are high, and the graphical representation is impressive.
For example, there is a clear correlation between the price index of corn seed in France and French newborns named Lucien, or between tourists in Nepal and taxes collected on horse betting. But correlation is not causation, and of course neither of the two phenomena observed explains the other

These abusive conclusions are sometimes encouraged by two effects:
- Differences in scale and units, which make it possible to superimpose curves, provided they are twisted a little. This is often the case when you have a preconceived idea that you absolutely must support.
- Similarities in context that lead to shortcuts. This often reveals a 3rd hidden phenomenon that explains – at least in part – the correlation observed. For example, a strong correlation between the purchase of sportswear and foot sprains.
When the first increases, so does the second.
We might be quick to conclude that buying shorts causes sprains, but we might be more cautious in concluding that a third factor is at the root of the problem: trends in jogging (if jogging increases, so do the other two).
And in Revenue Management?
In our business, Revenue Management, where the forecasting process is key, some players are tempted to exploit the mass of data now available to make correlations in all directions. And when you look, you find.
They are a little too quick to skip over all the verification processes, the rigorous analysis, the business meaning to be given to these variables, and they quickly set foot on the minefield of certainties.
Here’s another example. There’s a correlation between good weather and the number of bookings at campsites. There are more customers in August than in September because the weather is more favourable.
Possible conclusion: if it’s sunny, let’s raise prices, if it’s raining, let’s lower them. But do a lot of customers book in August because the weather is good, or simply because it’s the school holiday period and a lot of families go camping?
To find out, let’s superimpose all the booking curves for August over the last 2 years, whatever the weather. And on the other hand, let’s superimpose all the curves with good weather, whatever the date. You’ll see whether it’s the weather that wins out or the seasonality of August itself.
Let’s be vigilant, and put some sense into our analyses.
Written by Pascal Niffoi
Keywords: Causality, Correlation, Le Monde, Revenue Management, forecast, tourism